Overview
To help you better understand your direct mail campaigns’ progress and ultimate results, we’ve developed the concept of data maturity.
How mature a campaign’s data is refers to how “baked,” or final, the results are. The more “baked” the results are, the closer a campaign is to completion—or in other words, how much time has elapsed within the maturity window.
- Our default maturity window is 60 days.
We think of and calculate data maturity on the following scale:
- Mature: 80–100% through maturity window
- Nearing maturity: 50–79% through maturity window
- Early data: Below 50% through maturity window
Note: Data maturity differs in one-off and automated campaigns. We will explain the difference below and what you can expect visualizations to look like based on the campaign type.
Visualizing Data Maturity in the PostPilot App
Data Maturity for One-Off Campaigns
Data maturity for one-off campaigns (i.e., a bulk mailing to a single, static customer segment) is visualized as a progress bar correlated to the maturity window. For example, if the campaign is 31 days old, the visualization would show campaign progress at 52%. Additionally, it would show that there are 29 days left and be in the nearing maturity stage.
Below is an example as it would appear when data is mature in an individual campaign dashboard.
The bar will change color and track progress through different stages. For instance, here is what it looks like for early data:
Note: The data maturity tool tip leads to this article.
Data Maturity for Automated Campaigns
Data maturity for automated campaigns (i.e., dynamically triggered mailings based on chosen parameters) is visualized to reflect that mailers may be at different stages of maturity.
Each postcard has its own data maturity percentage based on the day it was mailed.
As a result, the bar will frequently show mailers at all three progress bars simultaneously.
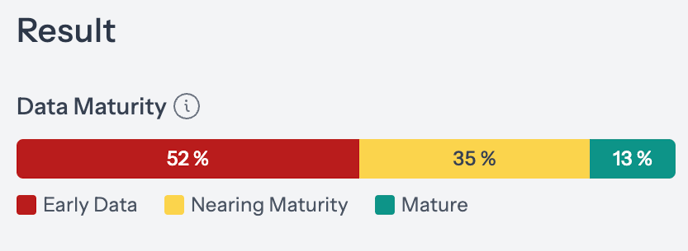
The exact breakdown will vary. It may change based on time of year or other marketing initiatives.
For instance, if you’ve recently pushed a large amount of traffic to your site (generating many more email signups), and you have an automated MailMatch™ retargeting campaign running, you’ll likely see a burst in early data.
Note: If you filter by a time frame with no cards sent, there will be a gray bar and it will say that no cards were sent.
Other possible data maturity states:
All early data (every mailer sent via automation is less than halfway through the maturity window):
All nearing maturity (every mailer is 51–79% through the maturity window):
All mature (every mailer is 80–100% through the maturity window):
(Example) How We Calculate Data Maturity for Automated Campaigns:
In a campaign of 6000 cards, if:
- 1000 are <50% mature
- 2000 are 50–79% mature
- 3000 are 80–100% mature
Then the maturity bar would read:
- 17% early data
- 33% nearing maturity
- 50% mature
Filtering by Mature Data in the Main In-App Dashboard
At the top of the Main In-App Dashboard, you can also filter data within the chosen data range by Mature Data Only or All Data.
By default, you will (likely) start on a date range that is not mature. If you want to see mature data, filter by Mature Data Only.
- The red ❗icon will show that displayed data may not be mature.
When you choose a date range that includes entirely mature data, a green ✅ will appear.
